To read about Raye Resources' flagship project, please visit the New Nanik page of this website.
The 387 square kilometer New Nanik Property is a mineral property of merit located approximately 100 km south-southwest of Smithers, 80 km southwest of Houston and 90 km southeast of Terrace in central British Columbia.
The property encompasses the New Nanik copper-gold-molybdenum developed prospect and the newly-discovered MacLean hydrothermal system at Mt Bergeland.
It is 30 km northwest of the past-producing Huckleberry copper-molybdenum-gold-silver mine and 8 km west of the Berg copper-molybdenum-silver deposit.
Geology and Target Areas
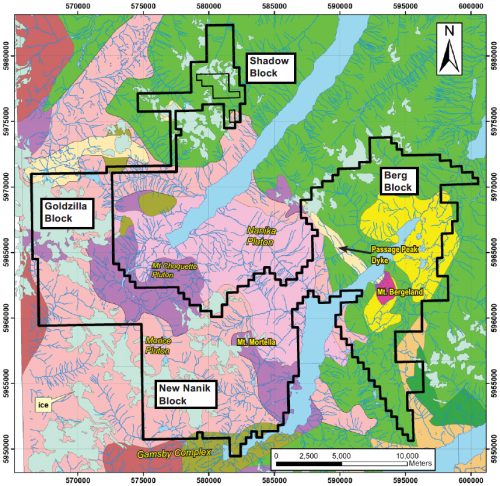
This is a geological map of the property with its different blocks named by the primary target within the block.
The New Nanik copper porphyry prospect is the most advanced on the property having delivered, after limited drill-testing, a best intercept of 0.46% copper over 97.5 m in borehole GR-69-03.
It is followed in maturity by the MacLean copper porphyry target in the Berg Block. Maclean is characterized by extensive veining of ore (Cu-Ag+/-Mo) and pathfinder elements on Mt. Bergland immediately east of Nanika Lake.
The Goldzilla gold target in the western Goldzilla Block of the property is associated with the Coast Mountain intrusive suite.
The Shadow Block includes a number of named BC Geological Mineral File showings with reported Cu/Zn (Au) skarn and VMS affinities.
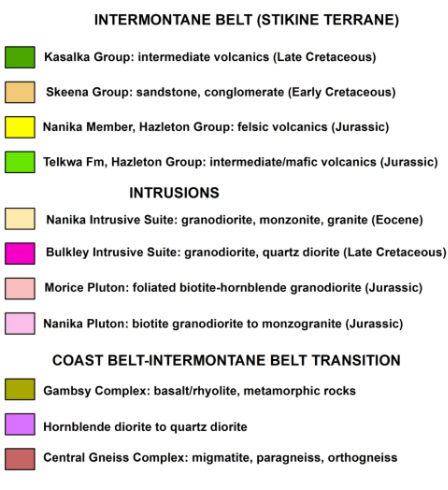
The legend to this map may be viewed by clicking here or scrolling down to the second-last graphic on this page.
Geochemistry and Named Targets
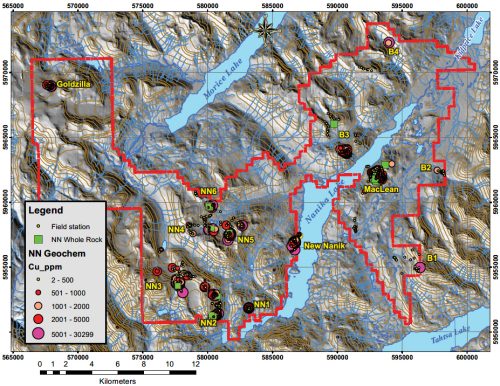
This map is labeled with named targets and is symbolized to show the location of 2020 to 2022 rock sampling with sample copper concentrations.
No sampling of the Shadow Block has to date been undertaken by RRI or the optionor.
More detailed geochemical maps may be viewed on the New Nanik and MacLean pages of this website.
Geophysics: Magnetics
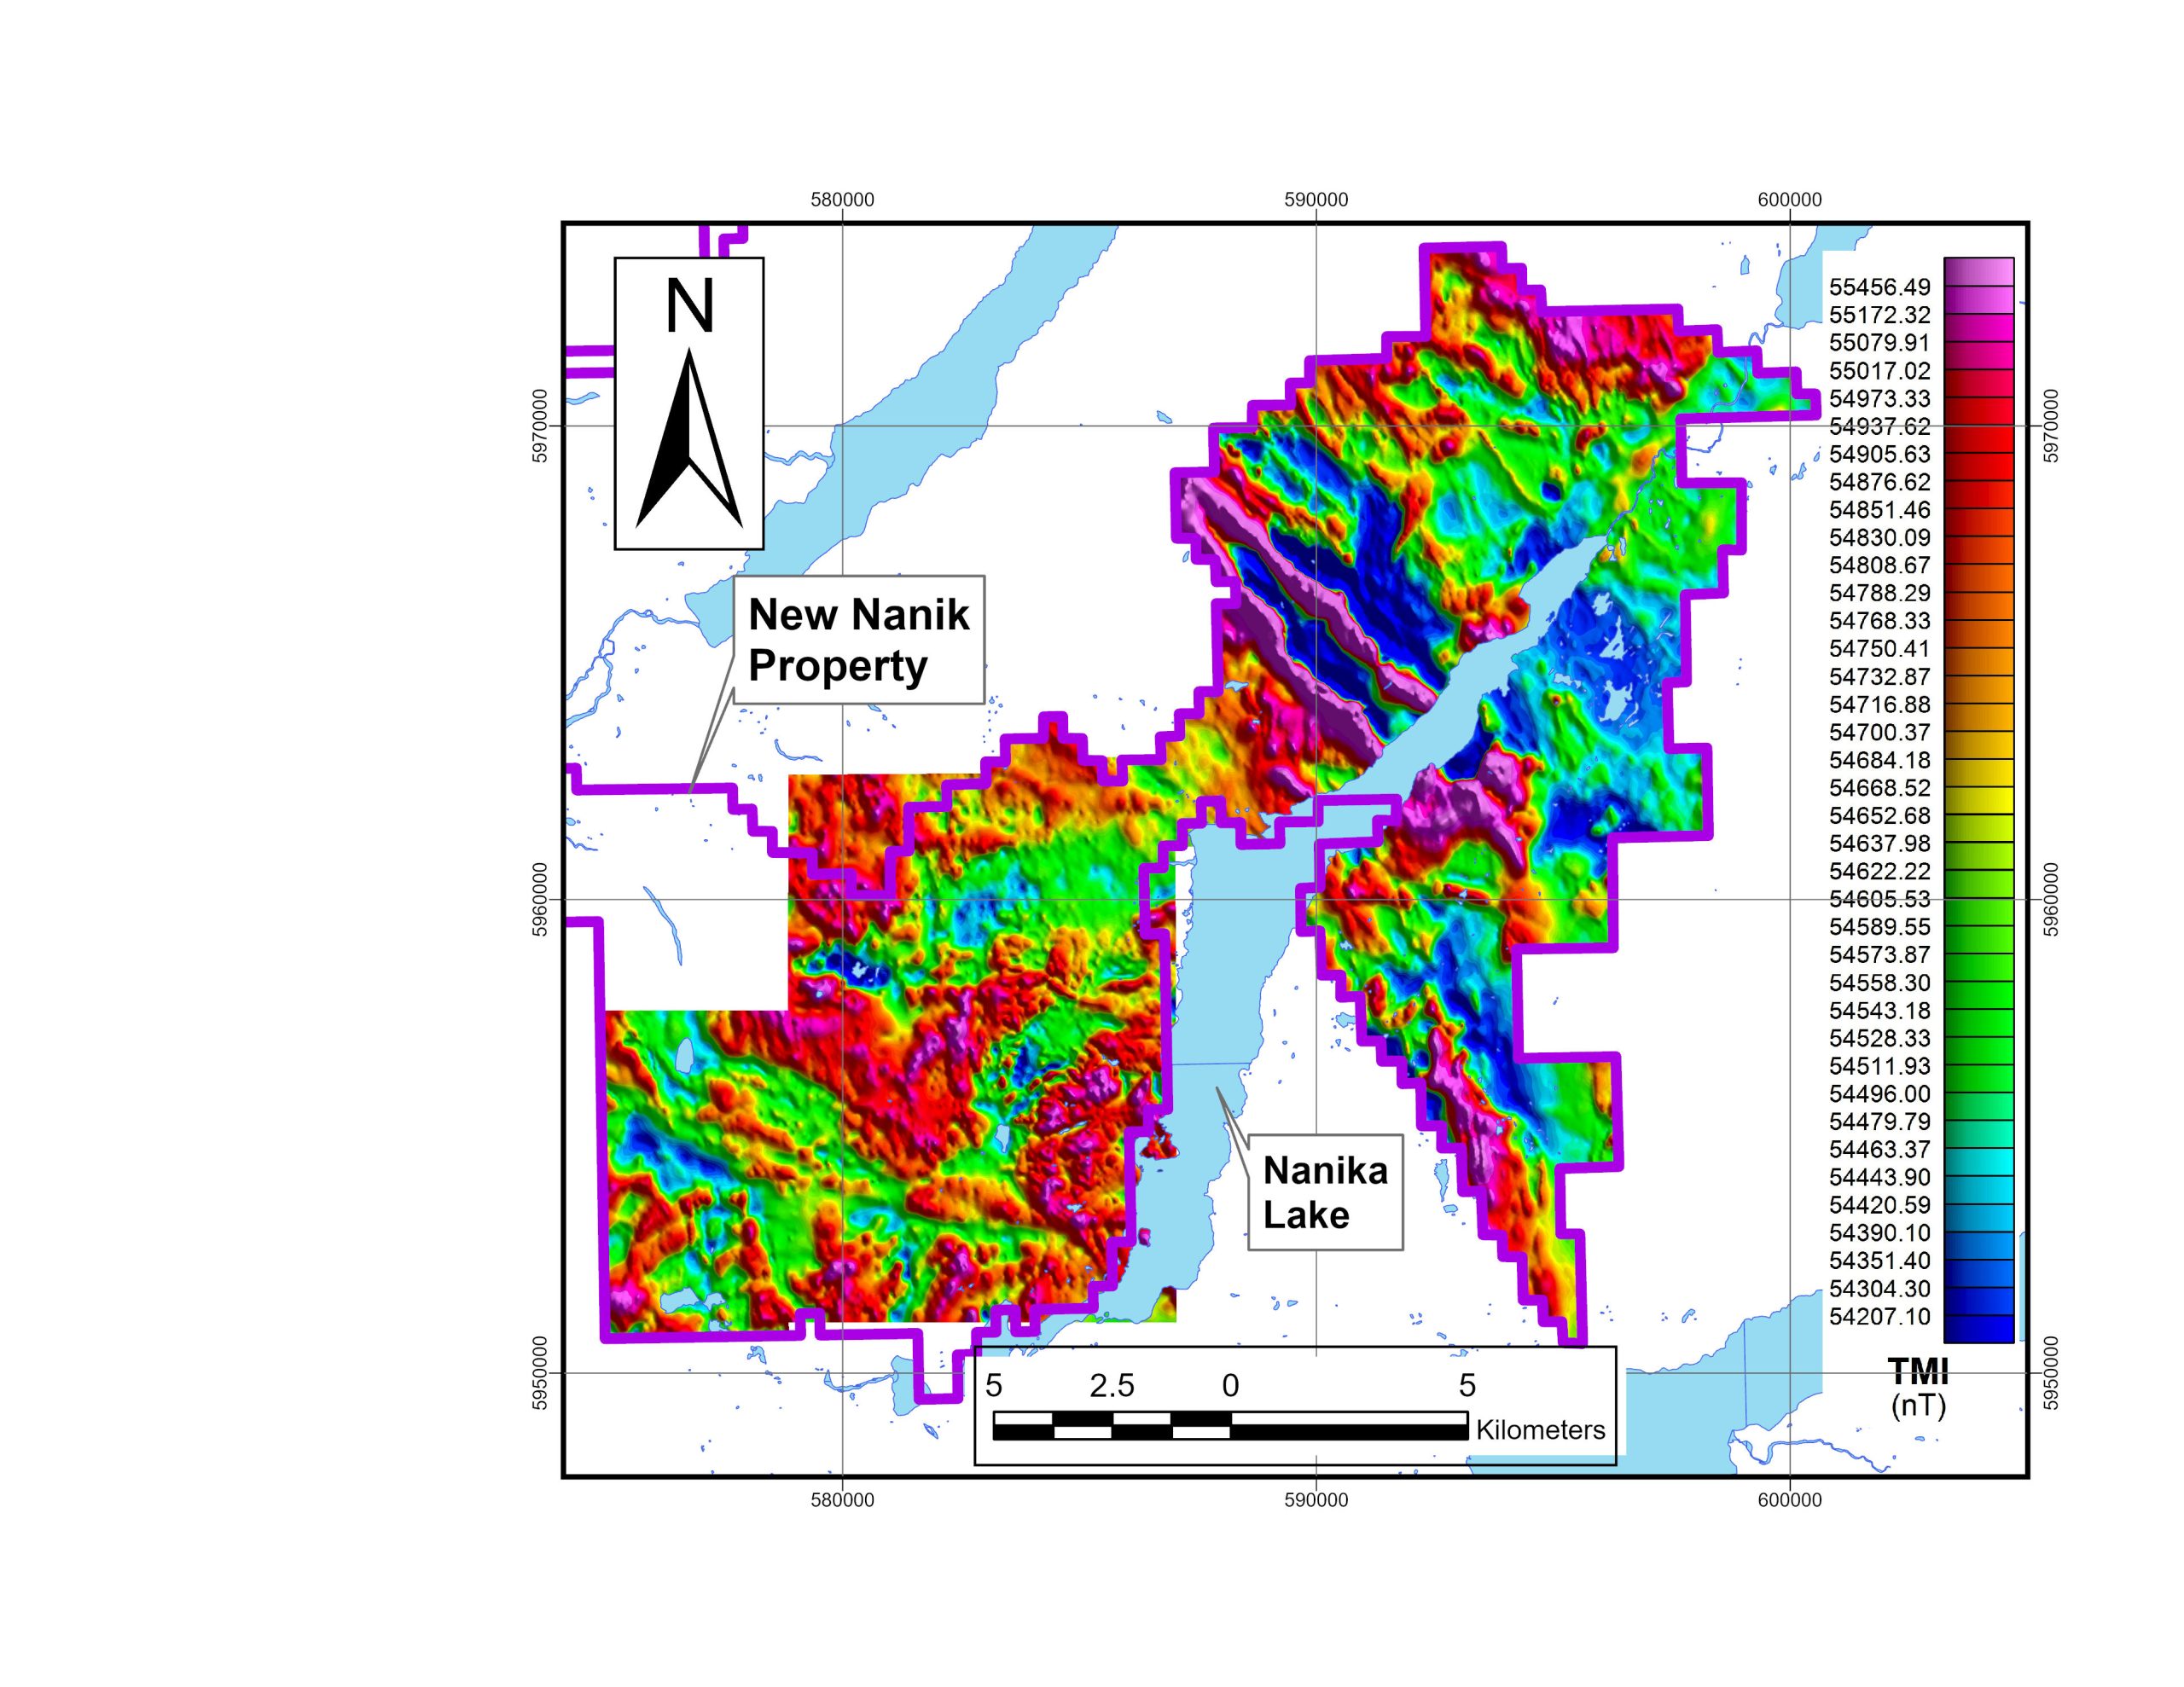
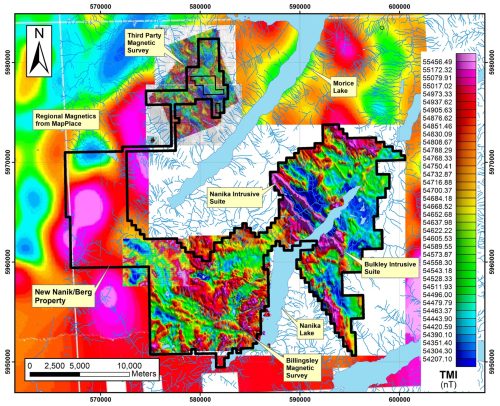
This illustration shows a total magnetic intensity map of the Berg and New Nanik blocks, integrating two surveys which were flown by the optionor in different years.
The resolution improvement over available government magnetic survey data, shown in the background around the New Nanik property, is stark.
See the illustration at the bottom of this page which provides a slider to dynamically add and remove the potassium radiometrics map from an overlay on the TMI magnetics map.
Geophysics: Radiometrics
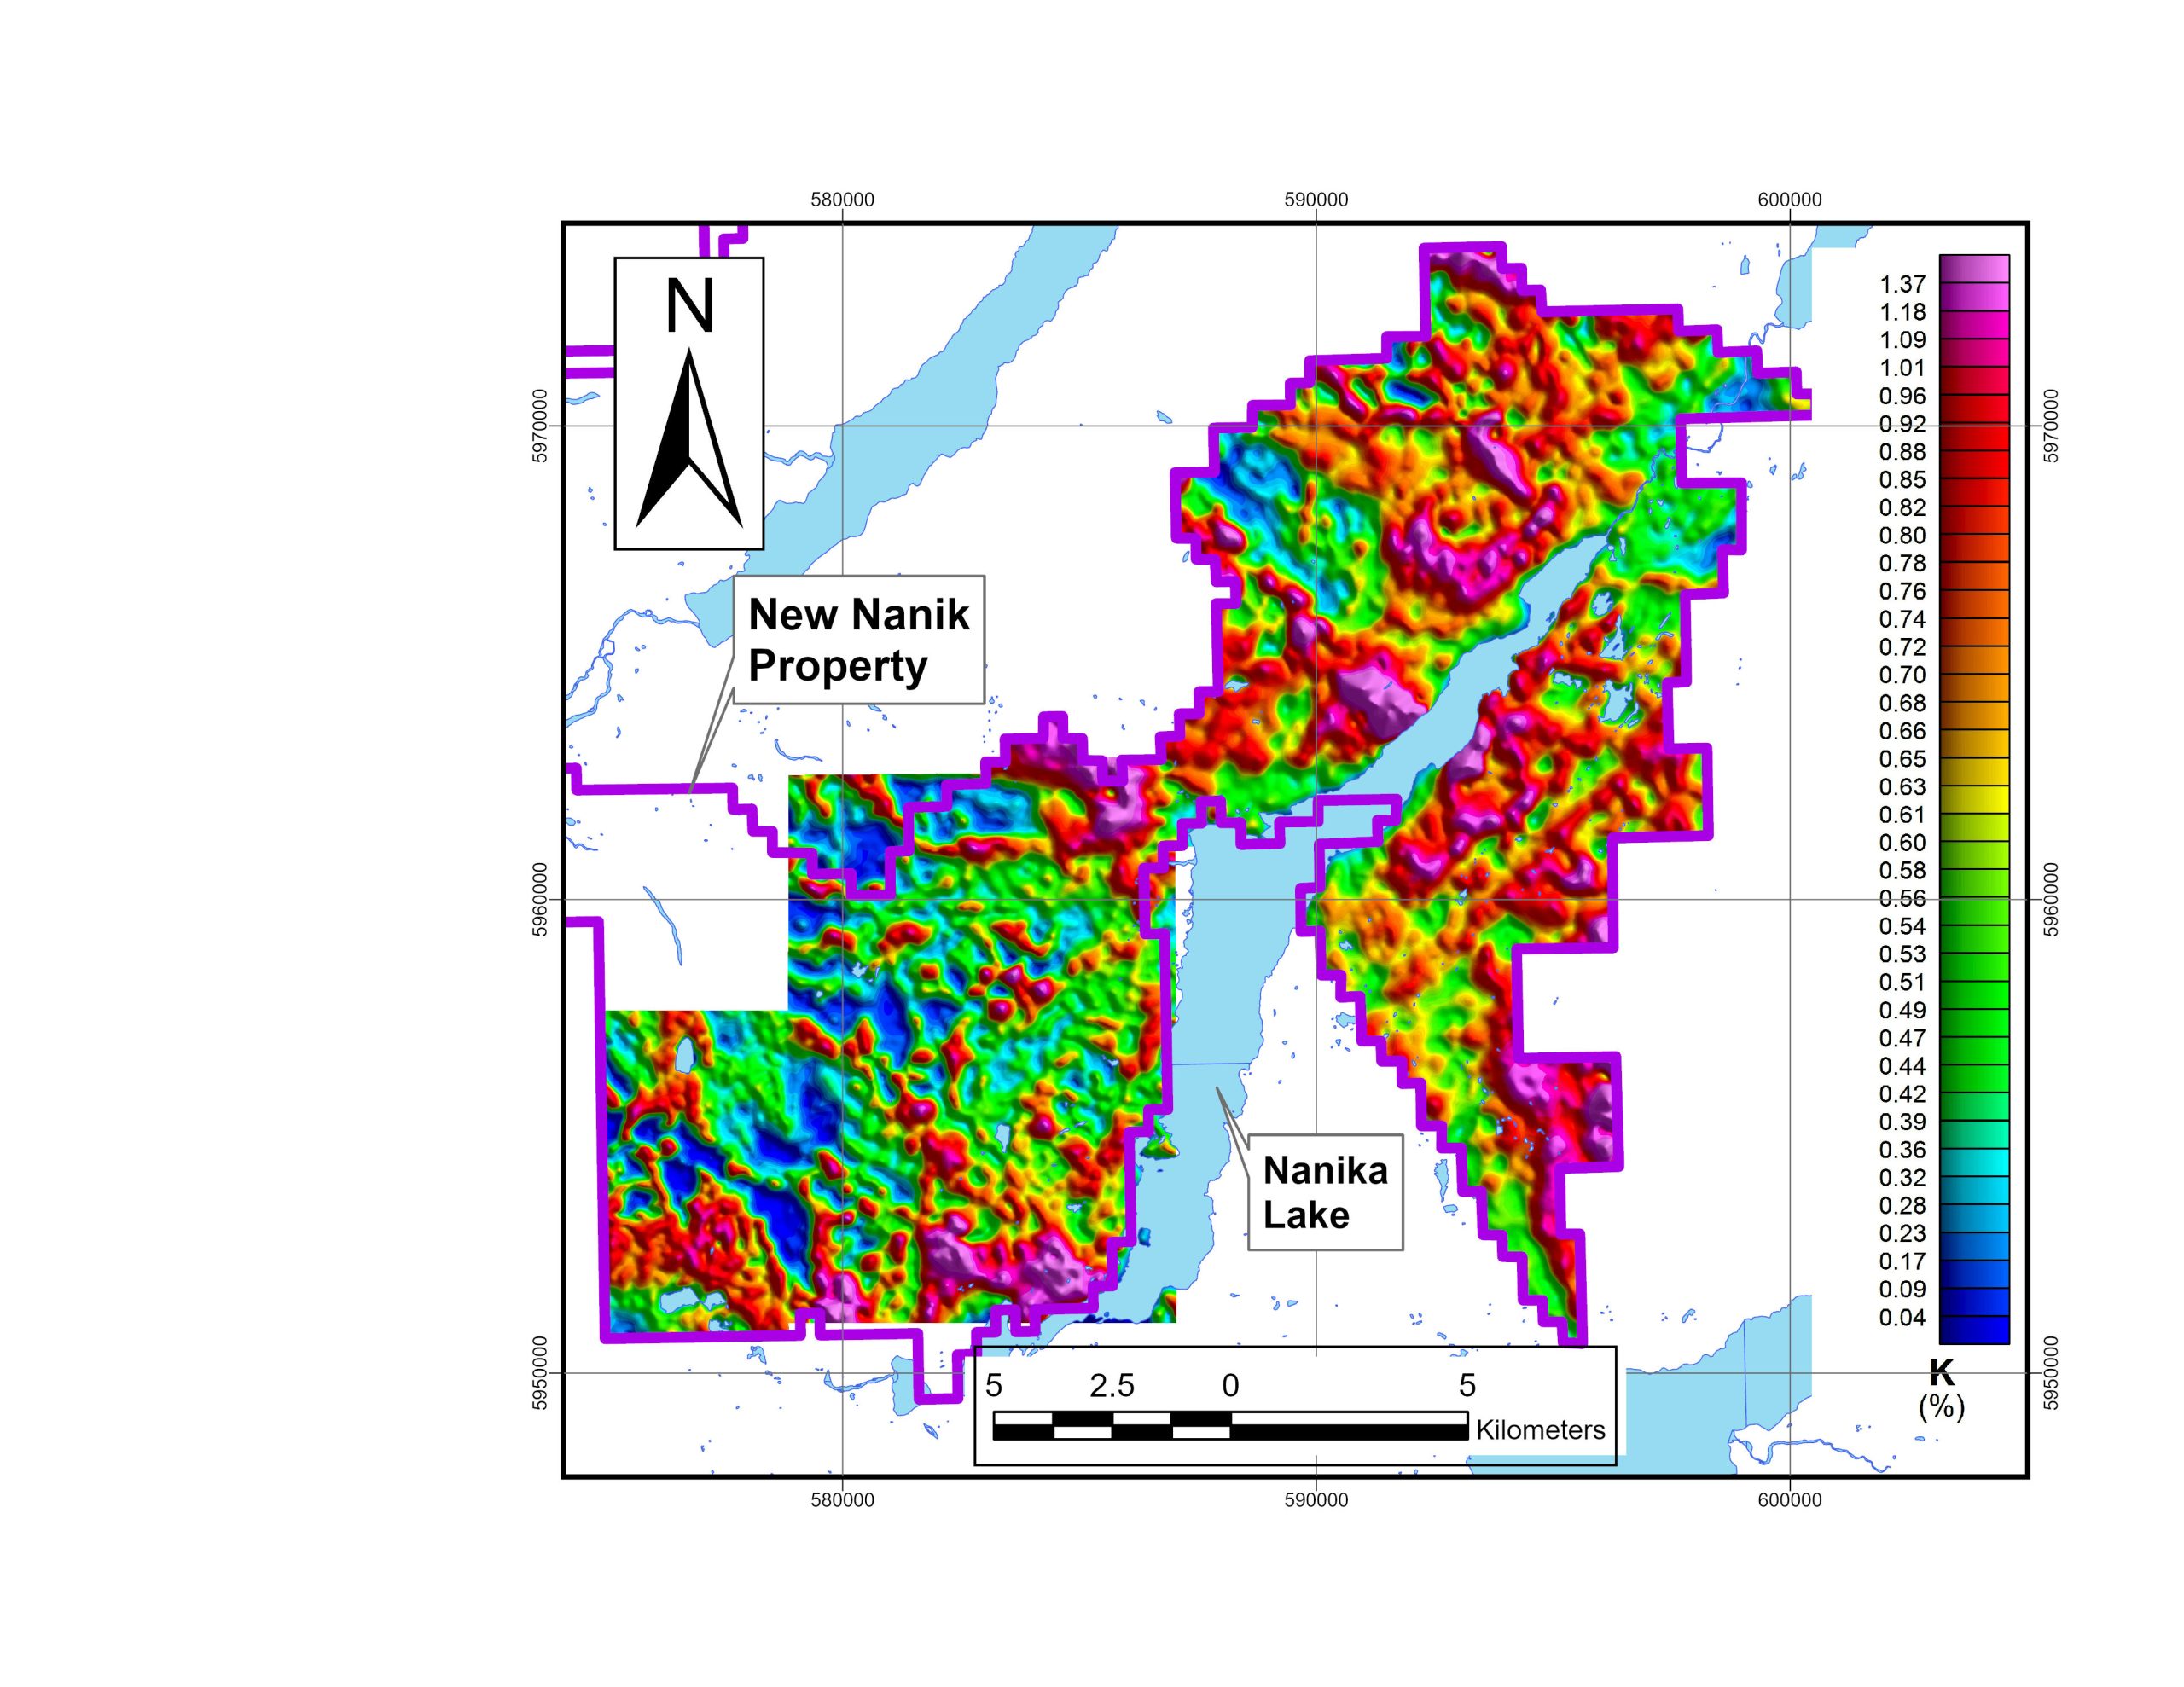
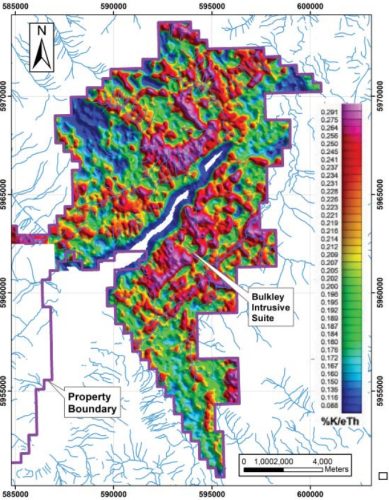
This potassium/thorium ratio map shows the extent of radiometric survey coverage of the property.
Significant features of radiometric maps that are present, or not present, in magentics maps of the same area contribute substantially to enhancing geological maps. The same is true for the relationship between features in magnetics maps and their corresponding radiometrics maps.
Conductivity maps add a third dimension to the geophysical interpretation of a property. RRI is planning an airborne conductivity survey as part of the next phase of its exploration at New Nanik.
Airborne Geophysics Survey Results Comparison
The maps below show K (potassium) radiometrics results to the left of the vertical divider, and Total Magnetic Intensity (TMI) to the right.
The mouse pointer may be used to move the vertical divider backwards and forwards to the left and to the right.
This makes it easy to see where different and similar spatial features are present in the two data sets which are derived from very different rock properties.
Interpretation of these spatial feature can play a very important role in discovering mineral deposits.
